Your Test Data Sheet: What to Expect
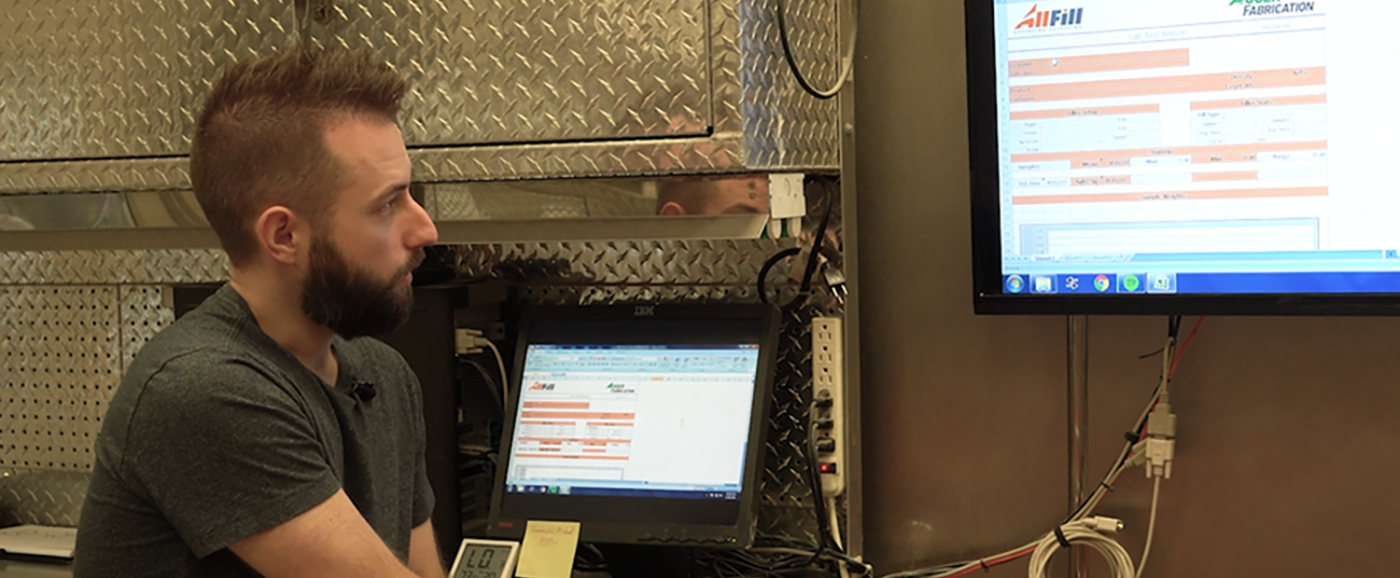
| You might be familiar with our complimentary test lab services, tailored to uncover the ideal tooling for your product. But have you ever wondered about the process of recording and interpreting that data? Our lab technician, Chris, provides a comprehensive explanation of the standard Test Lab Data Sheet he utilizes to aid customers in understanding their specific product. Once the customer communicates with our sales team and sends in samples of their product along with the desired container, testing can begin. Leveraging the provided samples and application details, Chris identifies the filling challenges and demonstrates a proof of concept on a detailed data sheet. Below, our data sheet is broken down by category to to explain what information is presented to each customer at the completion of testing. |
|
Contact and Product Information
The customer's information and the name of the sales representative must be included. This establishes a direct point of contact for any inquiries or discussions related to the testing and its outcomes. Additionally, understanding the nature of the product, whether it's a powder, a granule, or a liquid, is essential for evaluating the performance of the packaging machinery. Here, Chris also records the container size, shape, and material composition to provide context for the testing parameters.
Technical Product Information
Product-specific metrics like density and target weights are key factors that influence the filling process. Understanding the density helps to determine the ideal tooling size while the target weight specifies the desired quantity of product to be dispensed into each container. This serves as a benchmark for evaluating the accuracy of the packaging machinery.
Machinery Specifics
Chris documents essential details regarding the machinery most suitable for the application. Metrics such as the rotational speed of the fill motor (RPM) and the number of auger revolutions directly impact the cycle time. The cycle time is the total duration of a fill cycle, from the beginning of filling to the end of dispensing. Additionally, the "Filler Setup" section identifies the type and size of the auger, funnel, and agitation blade used, along with the RPM of the agitation motor.
Data Points, Statistics, and Graphs
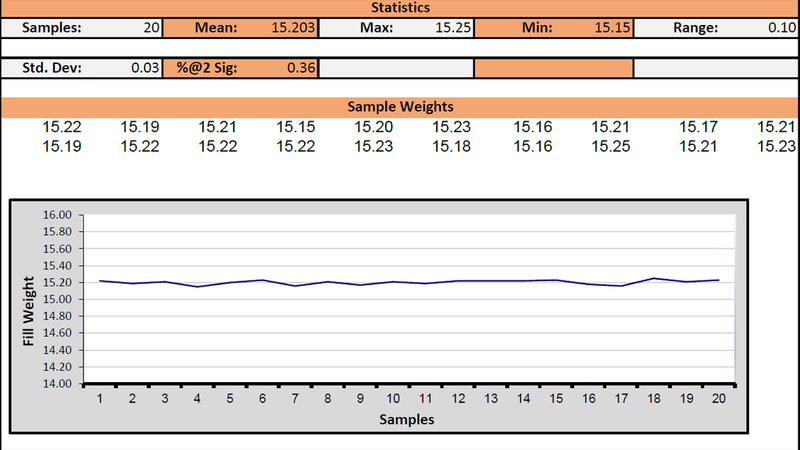
Customers can see the numbers relating to their product's performance. Data points reference the fill weight dispensed at each cycle of the auger filler during testing. The number of sample weights collected are shown along with several statistical measurements including mean, maximum weight, minimum weight, range, standard deviation, and accuracy. Graphs further illustrate fill weight variation over the duration of the test, allowing for visual analysis and interpretation of trends and patterns.
Notes
This section offers a space for recording any anomalies, adjustments made, or recommendations for improvement. Product characteristics such as dustiness, flowability, and target weight issues are also highlighted here.

